Invest with data.Not opinions.
Backtest strategies, monitor your portfolio, research company fundamentals, and measure any asset’s risk and performance. All in one platform.
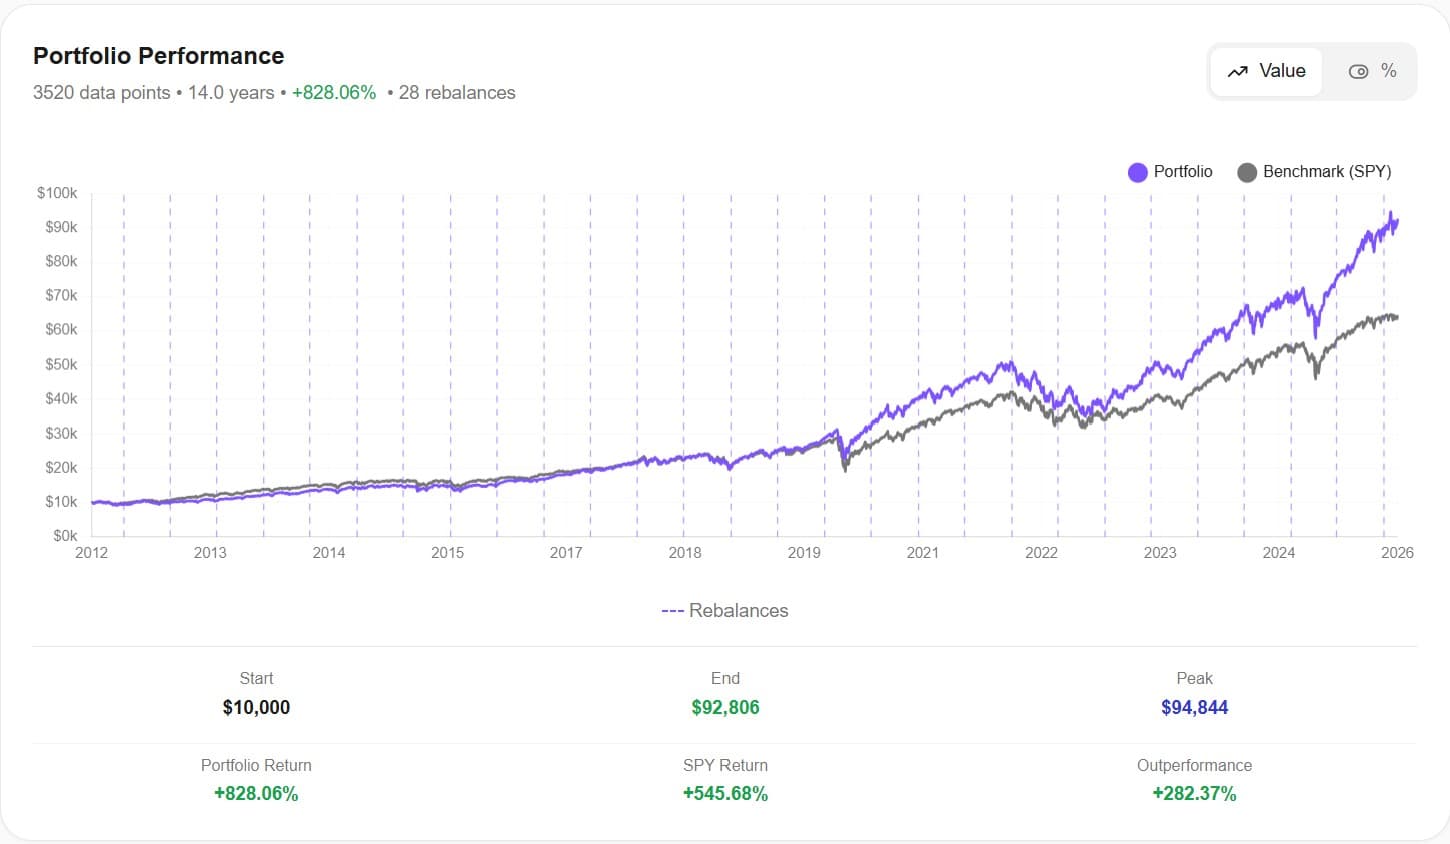
Sample backtest, 2012–2026. Past performance does not predict future results.
Most tools only solve part of the problem.
You shouldn't need five different apps to understand your investments. And you definitely shouldn't trust AI that makes up financial data.
Backtesting here, fundamentals there
One tool for backtests. Another for stock analysis. Spreadsheets to tie it together. You waste hours switching between tools that don't talk to each other.
| Asset | Before | After |
|---|---|---|
| Equity | ? | ? |
| Bonds | ? | ? |
Black boxes everywhere
Most tools don't show their math. Monthly data that hides volatility. Rebalancing logic you can't verify. How can you trust results you can't audit?
Wrong numbers, confident delivery
Asked a generic AI for financial data? It invents numbers that look real but aren't. You need AI that analyzes calculated data, not one that makes things up.
Everything you need. One platform.
Awalyt combines portfolio simulation, risk analysis, fundamental research, and AI insights — all working together on verified data.
Backtesting · Risk · Fundamentals · AI
Simulate your portfolio over time
Test how your strategy would have performed with daily-precision data. Compare allocations, rebalancing rules, and time periods. See real drawdowns, not smoothed-over curves.
Understand your real risk
Quarterly correlation analysis shows how your diversification actually evolves — not just a single misleading number. See true volatility, drawdowns, and recovery patterns.
Research stocks with verified data
Access real financial statements, valuation metrics, and company comparisons. Pick stocks based on actual numbers, not headlines or hype.
AI that actually understands your portfolio
"Your US concentration (78%) amplified the 2022 drawdown. Adding 15% international would reduce max drawdown from -24% to -19%."
Our AI analyzes the calculated data from your backtests and research — it never invents numbers. Get contextual insights, risk explanations, and actionable suggestions you can trust.
A methodology you can understand — and audit yourself.
Awalyt is designed around clarity, not mystique. Under the hood, every figure is traceable: from daily price series to rebalancing events and tax assumptions.
Daily price data
More than 250 observations per year for each asset, providing statistically robust volatility, correlation, and drawdown metrics.
| Asset | Before | After |
|---|---|---|
| Equity | 58% | 60% |
| Bonds | 42% | 40% |
Transparent rebalancing
For each rebalance, Awalyt records dates, weights, and strategy rules, so you can review exactly what changed in the portfolio.
Integrated tax engine
Realized gains and losses are computed at each rebalance and tax is applied immediately, making results comparable and realistic.
Awalyt's methodology is fully documented in plain language, so you can understand, verify, and communicate how results are produced. No hidden formulas, no black boxes.
How investors use Awalyt in practice
Awalyt fits into your investment workflow, giving you a sharper analytical layer for better decisions.
Test before you invest
Run your strategy through 10+ years of daily data before putting in real money. See how it handles crashes, recoveries, and everything in between.
Check your diversification
Find out if your portfolio is actually diversified or just looks that way on paper. Quarterly correlation analysis reveals the truth.
Research with confidence
Analyze companies using real financial data. Combine fundamental insights with portfolio simulation to make informed stock picks.
Start with the data — free.
Create an account and use every module on the Free plan. No credit card. Upgrade to Premium when you need higher limits, longer history, export, and AI diversification.
What's included
Every module, on the Free plan:
- Backtesting — daily data and transparent rebalancing
- Asset Analysis — ETF deep dives, comparisons, risk and expenses
- Fundamental Analysis — financials, valuations, and AI summaries
- Portfolio Monitoring — allocation, drift, and correlation views
- Free public tools: DCA Calculator, ETF Overlap Analyzer
Invest with Data. Not Emotion.
Frequently asked questions
Everything you need to know before you get started.
Awalyt is built for investors who want depth without complexity. The AI helps interpret results, so you get professional-grade insights in plain language.
Daily data instead of monthly (20-30% more accurate risk metrics), tax-aware analysis, transparent rebalancing you can audit, and AI insights on your specific portfolio.
Unlike generic AI tools, our AI only analyzes data that Awalyt has calculated — real numbers from real market data. It never invents financial figures.
Awalyt has a Free plan — free forever, no credit card. Premium is $119/year ($9.90/mo, billed annually) with everything included: higher limits, up to 20 years of daily data, export, and AI diversification.
Daily price data from professional-grade market feeds. Financial statements from verified SEC filings and international equivalents.